Electro-optic measurements
A voltage U is applied between the
two ZnO layers, and a 512-wavelength (1700 - 370 nm) ellipsometer (J.A. Woollam Co.) is
used for measurements of the electro-optic (EO) effect in the BTO
layer. The voltage is varied between U = -100 ... +100V.
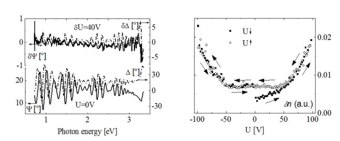
Changes in the ellipsometric parameters Delta and Psi are due to electric
field induced index-of-refraction changes parallel to
the growth surface within the BTO layer (Fig. 5).

Fig. 5.
Spectrally-averaged index differences versus voltage U
are depicted in Fig. 5. A linear
current-voltage curve is obtained, with maximum current of approx. 40 mA at U = 100 V.
To begin with, the index change is linear with U until approx. U = 50 V, according
to the linear EO-effect (virgin curve). For higher voltages the index change is
proportional to the square of U, indicative for paraelectric BTO (quadratic EO-effect).
The index change remains constant upon voltage reversal until U = -50 V, indicative for
reverse transition into ferroelectric BTO. Electro-optic Raman scattering measurements
show disappearance of the ferroelectric phonon modes (MOdes at 308 and 580 cm-1, Fig.
6).
The cause of the paraelectric phase transition is the parasitic leakage current, which
increases the sample temperature.
|
|
Fig. 6.
Preliminary temperature dependent dielectric measurements
reveal this phase transition at T = 111�C. In this structure, the voltage required for reversal
of the BTO domains is above U = 50 V, since
only the upper branch of the ferroelectric BTO hysteresis loop can be seen.
Further experiments are under way.
Collaborators: MPI for Microstructure Physics Halle (PD. Dr. D. Hesse), Semiconductor Physics Group, University Leipzig
(Prof. Dr. Marius Grundmann, Dr. Michael Lorentz)
Funding: Deutsche Forschungsgemeinschaft (SCHUH 1338/4-1,2) within Forschergruppe "Oxidic interfaces" FOR 404
|

